In previous research we showed participants a spreadsheet of data about courses and candidates to find out what data they would find useful.
We have now added reports to the prototype based on what we learned from that research.
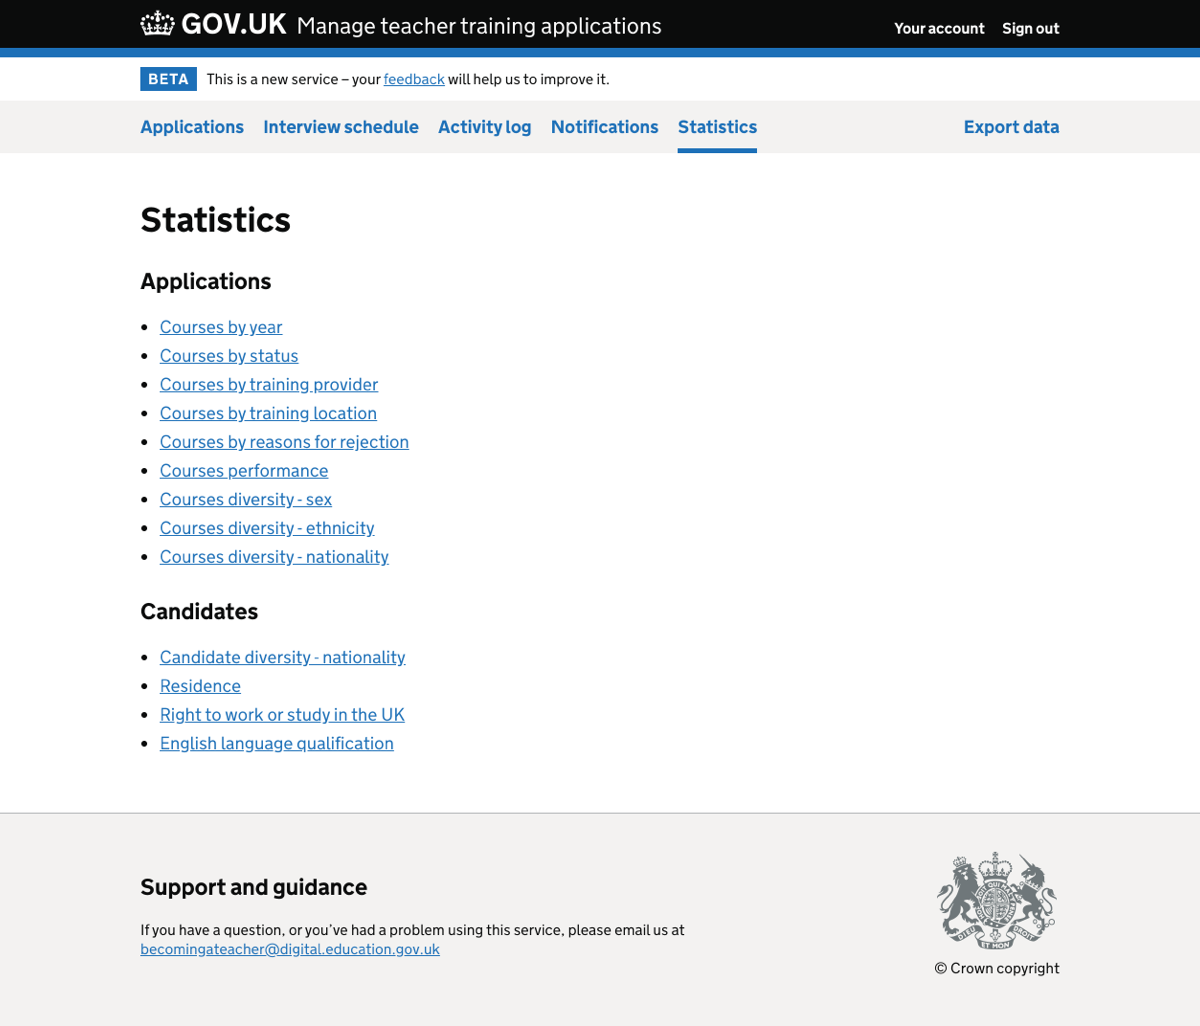
What we did
We created a new section of the service called ‘Statistics’, with links to various reports.
This includes reports about courses, split by:
- year
- status
- training provider
- training location
- reasons for rejection
- performance - the percentage of canidates who have moved between various statuses
- candidate sex
- candidate ethnicity
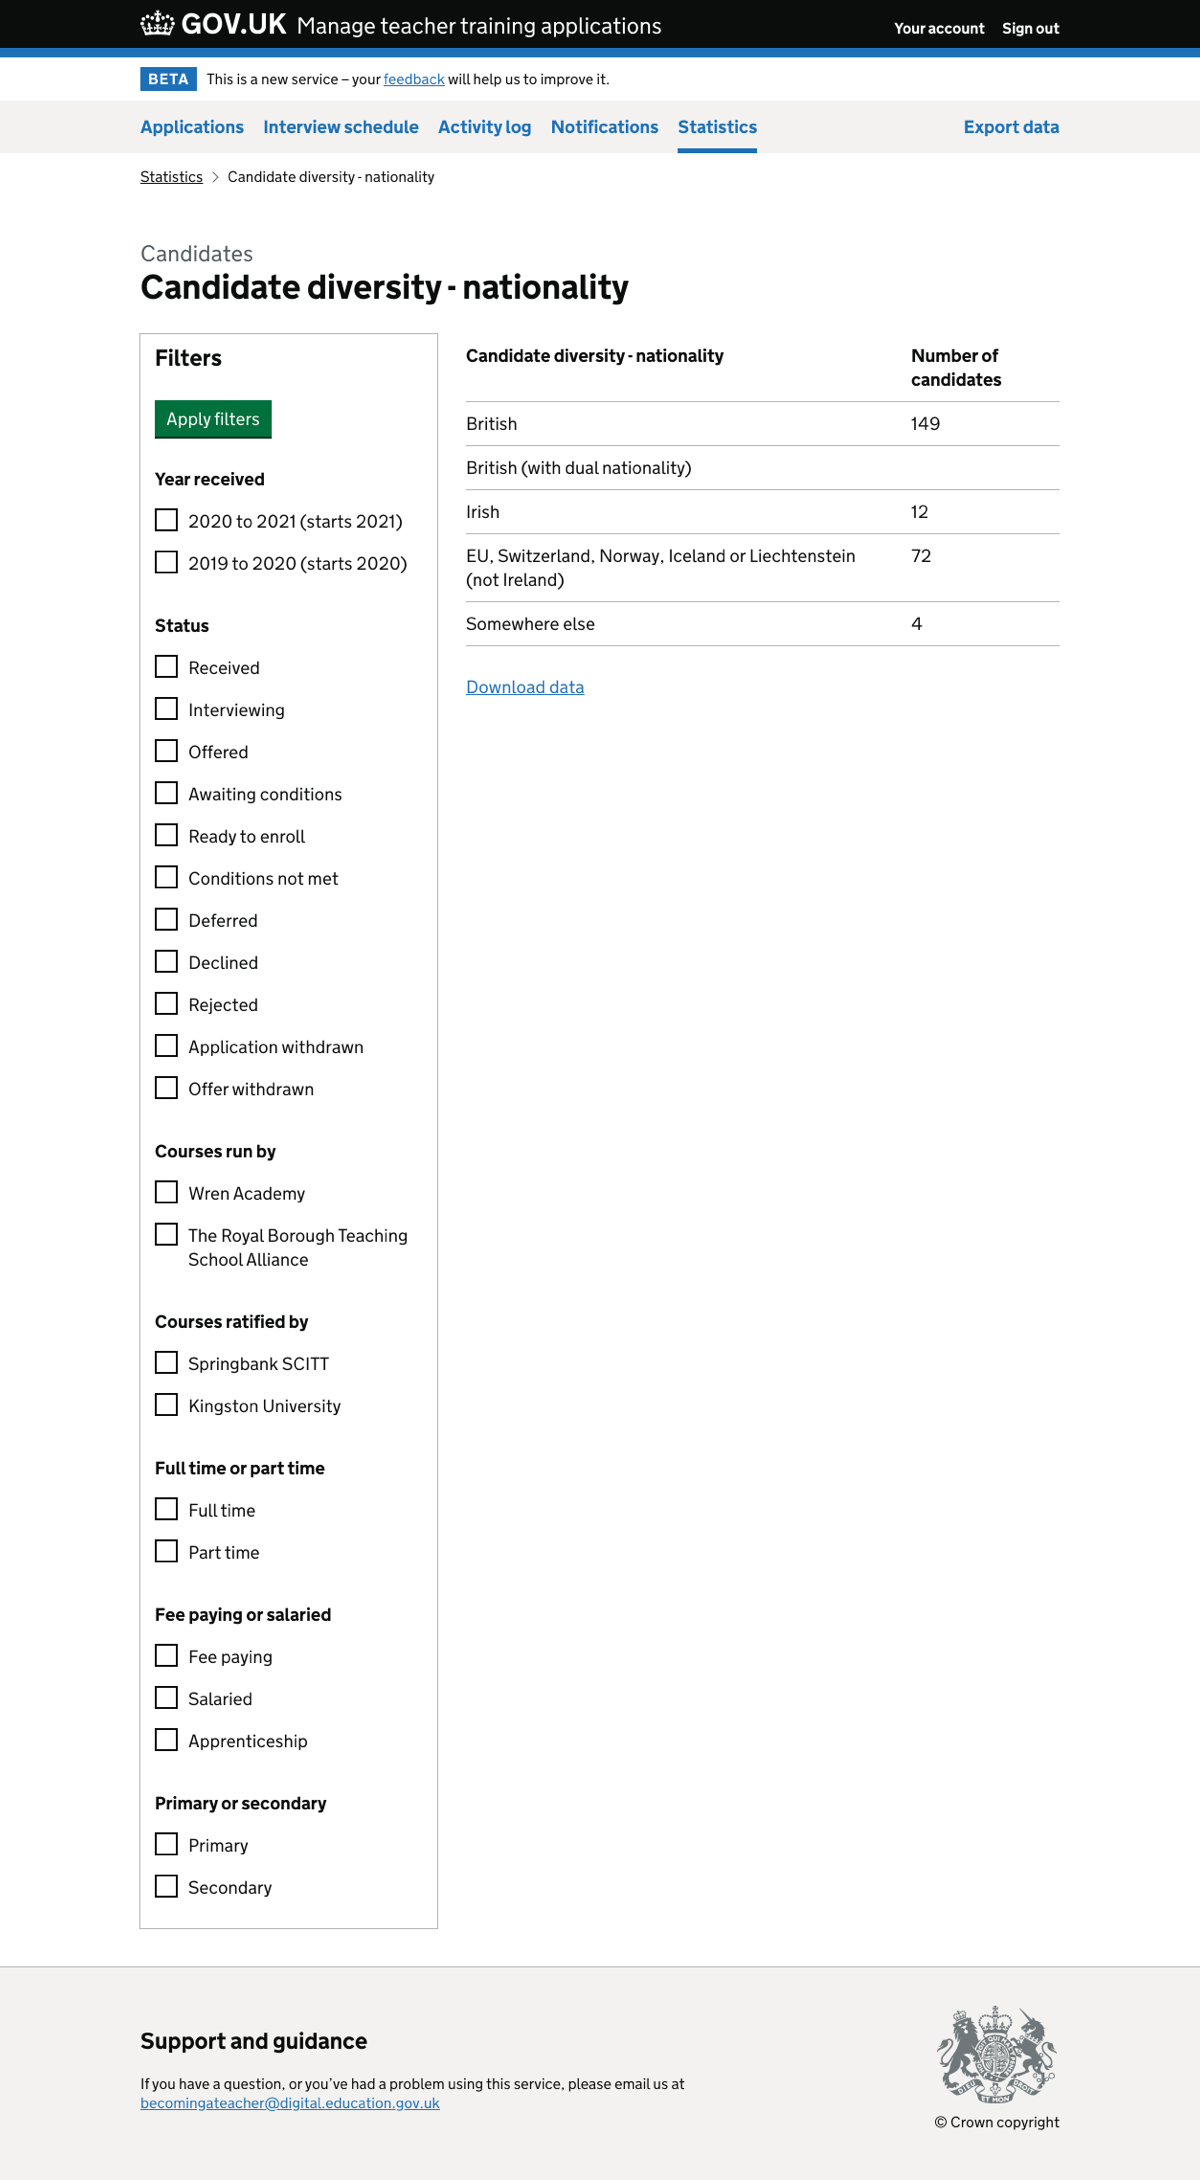
- candidate nationality
We also have reports about candidates, split by:
- nationality
- residence
- right to work or study in the UK
- English language qualification
Each of the reports has a filter to help users get the data they’re interested in.
How it works
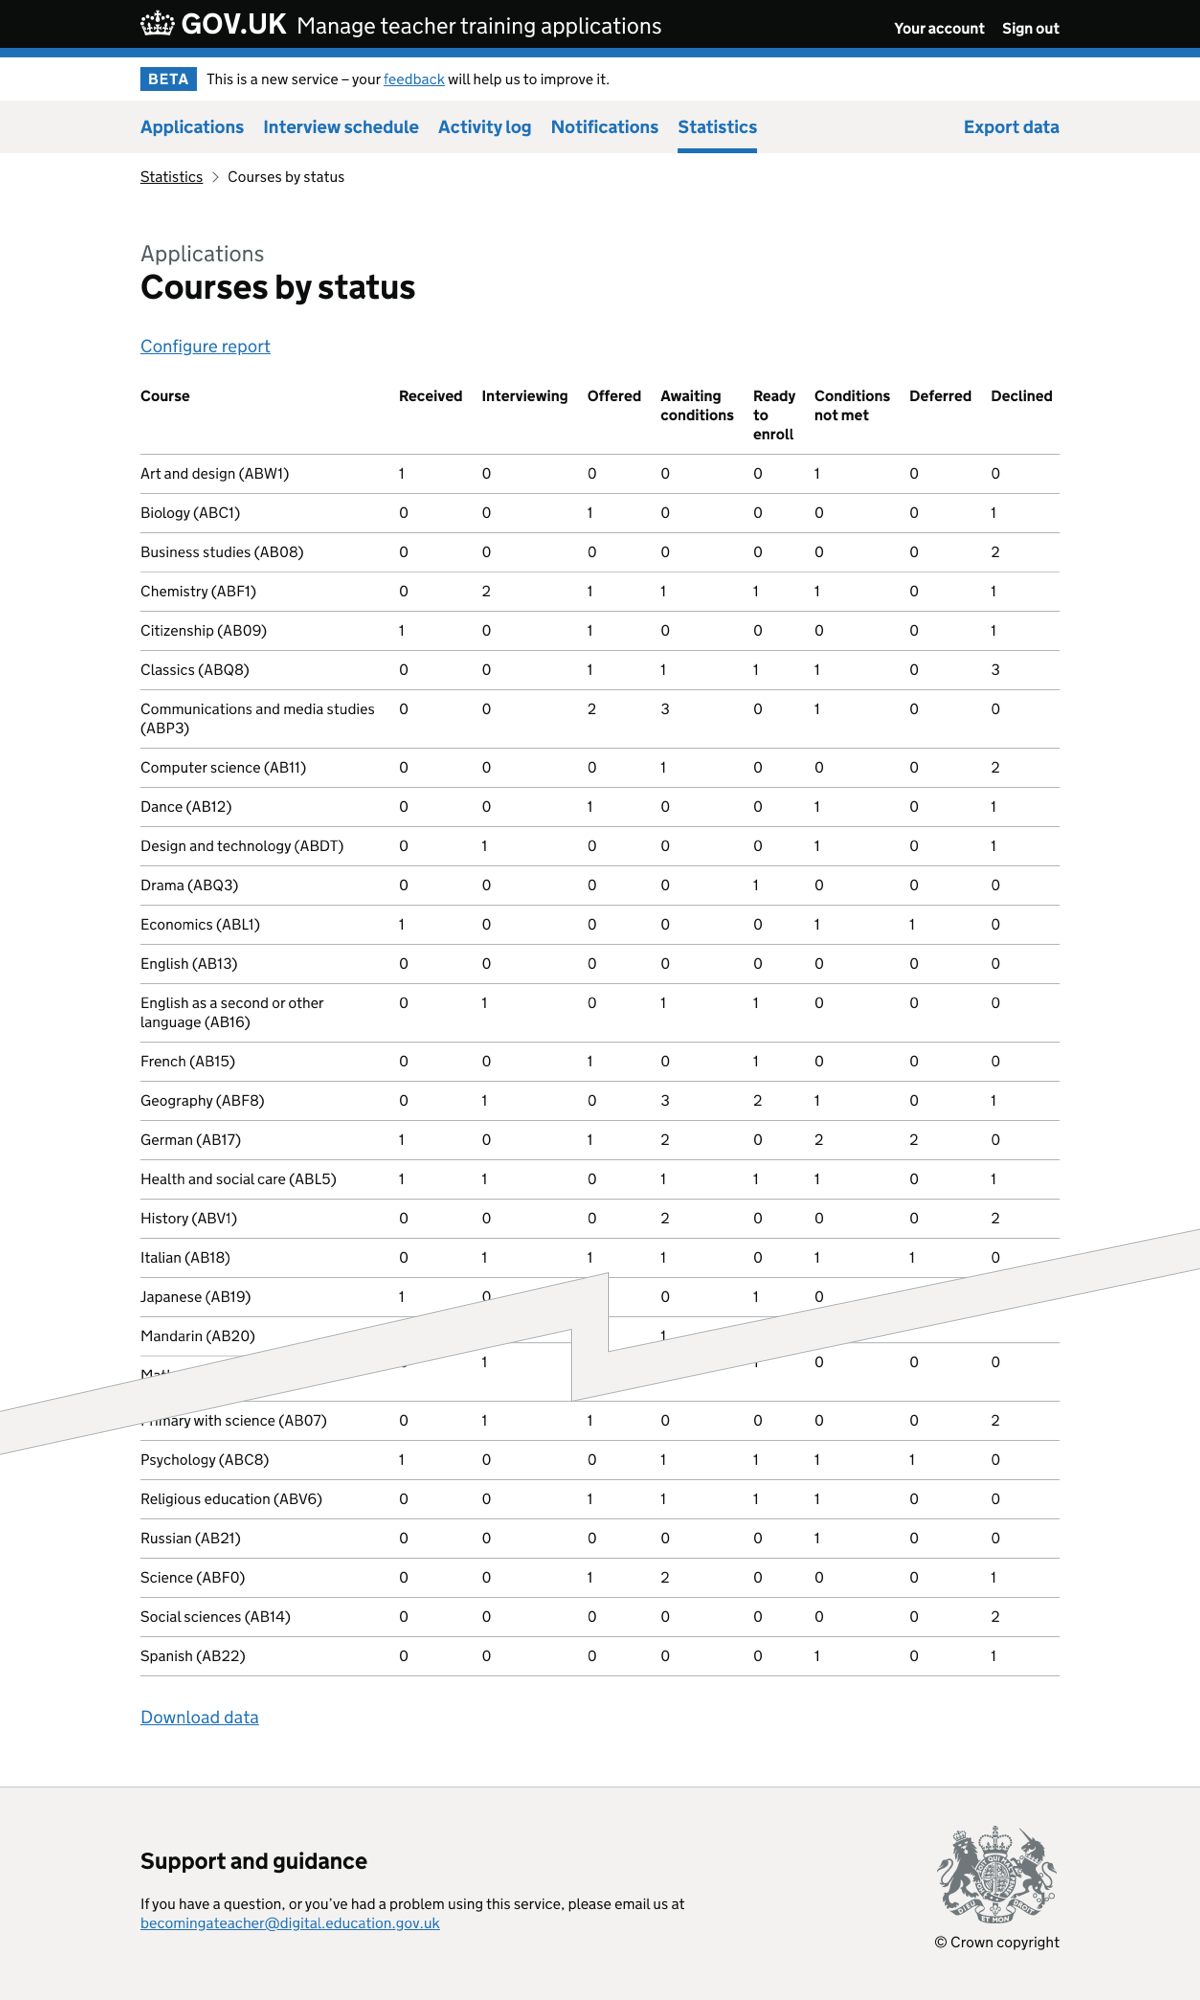
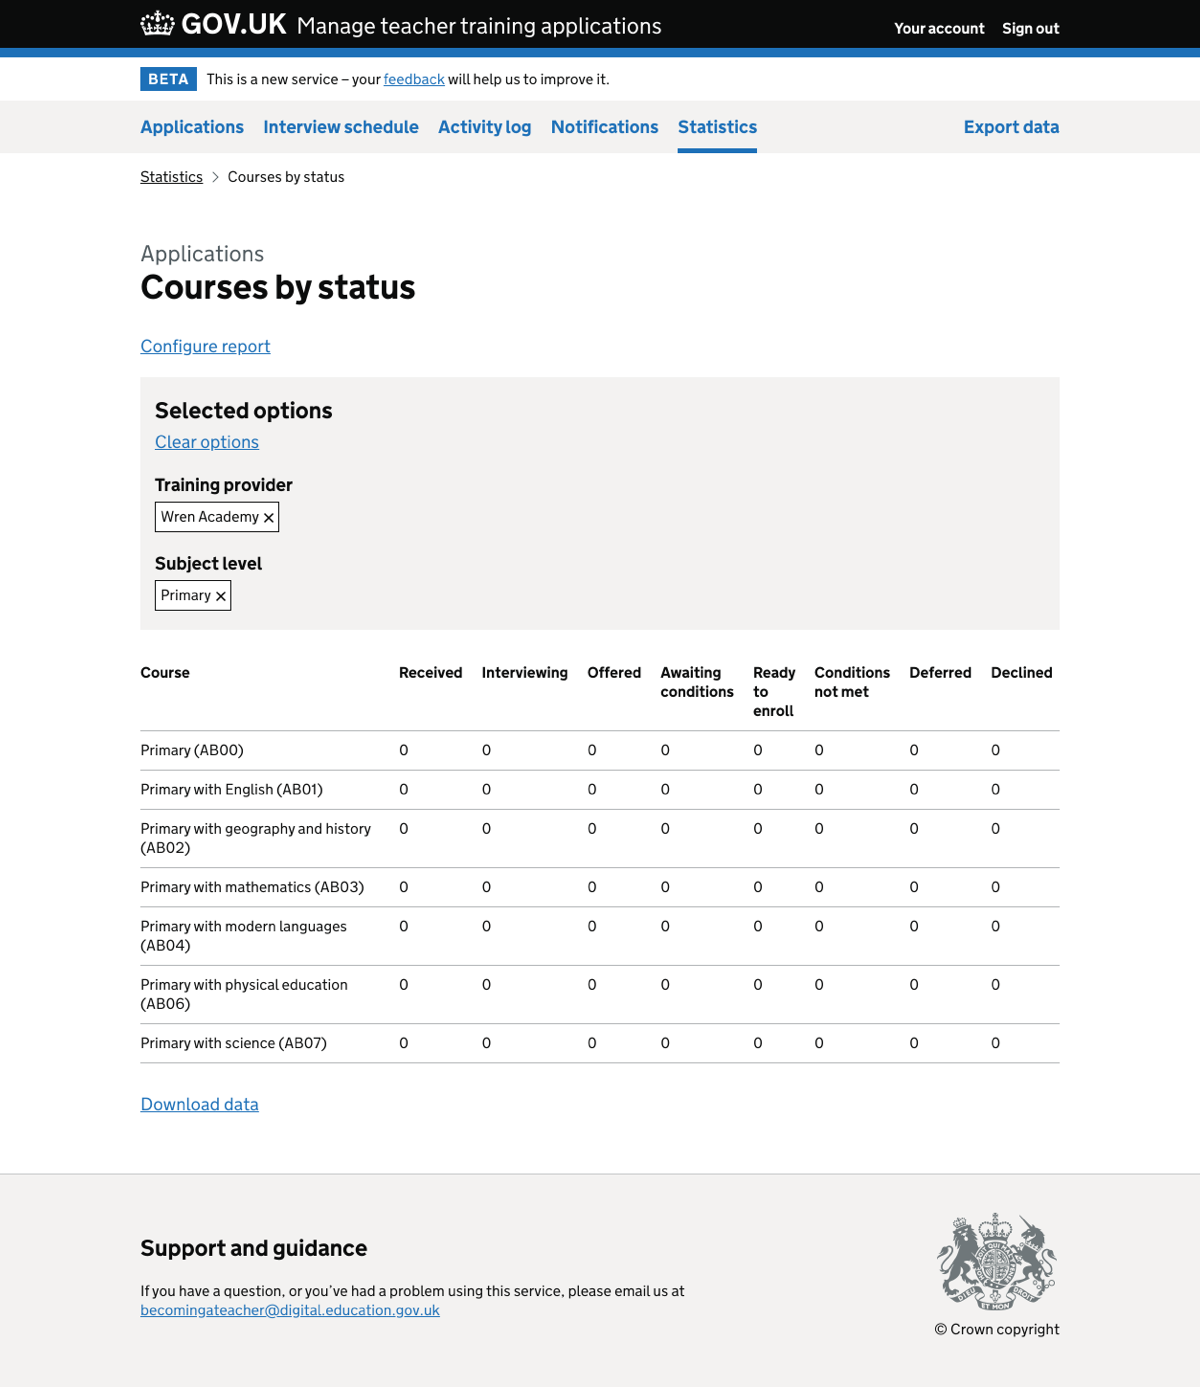
When the user clicks through to a report, they see all the data available for that report type. For example, for ‘courses by status’ they see data for courses:
- in the current and previous recruitment cycle
- at both primary and secondary level
- worked on by all the user’s organisations
- worked on with all partner organisations
The user can then filter this data. The way they do this depends on whether it’s a report about courses or candidates.
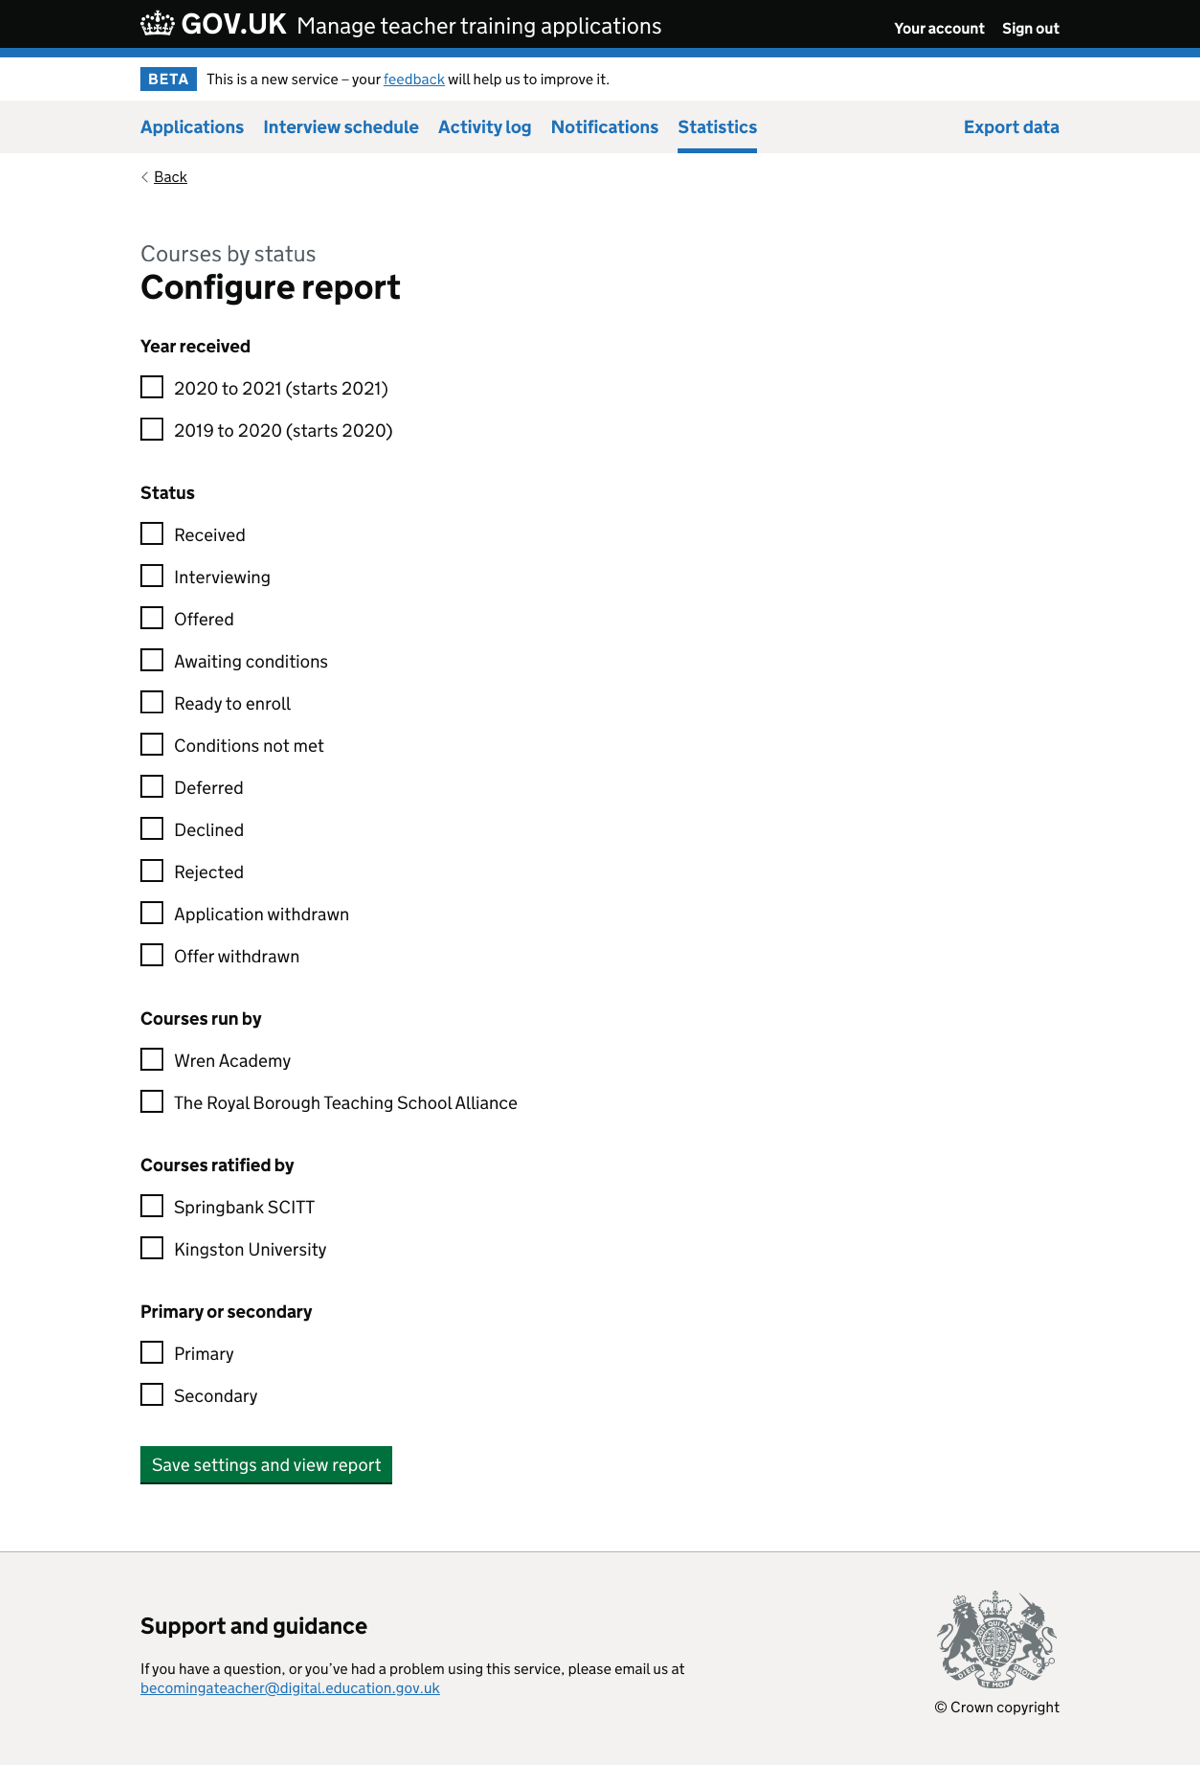
Filtering course reports
If the user clicks to configure a course report, they see a page with a list of filters which can include:
- year
- status
- courses run by
- courses ratified by
- primary or secondary
The list of filters varies depending on the report. For example, the ‘courses by year’ report cannot be filtered by year because the data is already split by year.
The user can select as many filters as they need and then click a button to return to the filtered report.
Filtering candidate reports
Since the candidate reports do not need as many columns as course reports, we decided to put the filter on the same page as the report. This means that users do not need to leave the page to filter the data.
If these designs go into production, we may reconsider this decision as it may be better to keep consistency between all reports.
Downloading data
Users can download the data they’re viewing using a link underneath the data table.
We had previously considered making the data available as a download only. We decided to design on-screen reports because:
- it’s easier to filter and see results on-page rather than downloading a new spreadsheet each time
- users will be able to access data without needing spreadsheet software
- there will be a single source of information which all users in an organisation can refer to
- users can be confident that they’re seeing the same information each time they access it
Screenshots#
Statistics page#
Courses by status report#
Filtering the courses by status report#
Courses by status report – filtered#
Candidate nationality report with filter#