Users need to see data about the applications they receive.
This data helps them make decisions and report to other people, for example when a course is close to being full.
Data provided by UCAS
Providers can see several reports in UCAS Weblink, including:
- interview decisions
- conditional and unconditional offers
- declined applications
- withdrawn applications
- cancelled applications
- applicant (candidate) data
The reports include data for the current and previous years. The detailed data is shown in tables and can be downloaded.
UCAS also publishes statistical releases. These are publicly available but do not give data for individual providers.
What we did and why
We were considering various ways of providing data in our service, including:
- displaying counts on the applications list
- sending a regular email to users
- providing data for download only
- adding reports to the ‘export data’ section
- creating a separate section for reports
From previous research we knew that providers track how many applications are at each stage of the process. They cut this data by date and compare it to previous years.
Most of our research had been with school-centred initial teacher training (SCITT) and school direct (SD) providers.
We decided to carry out more research to help us understand:
- what data providers need and what they do with it
- what methods of presenting data would be most useful to providers
- how providers want to manipulate data
- whether higher education institutions have different needs
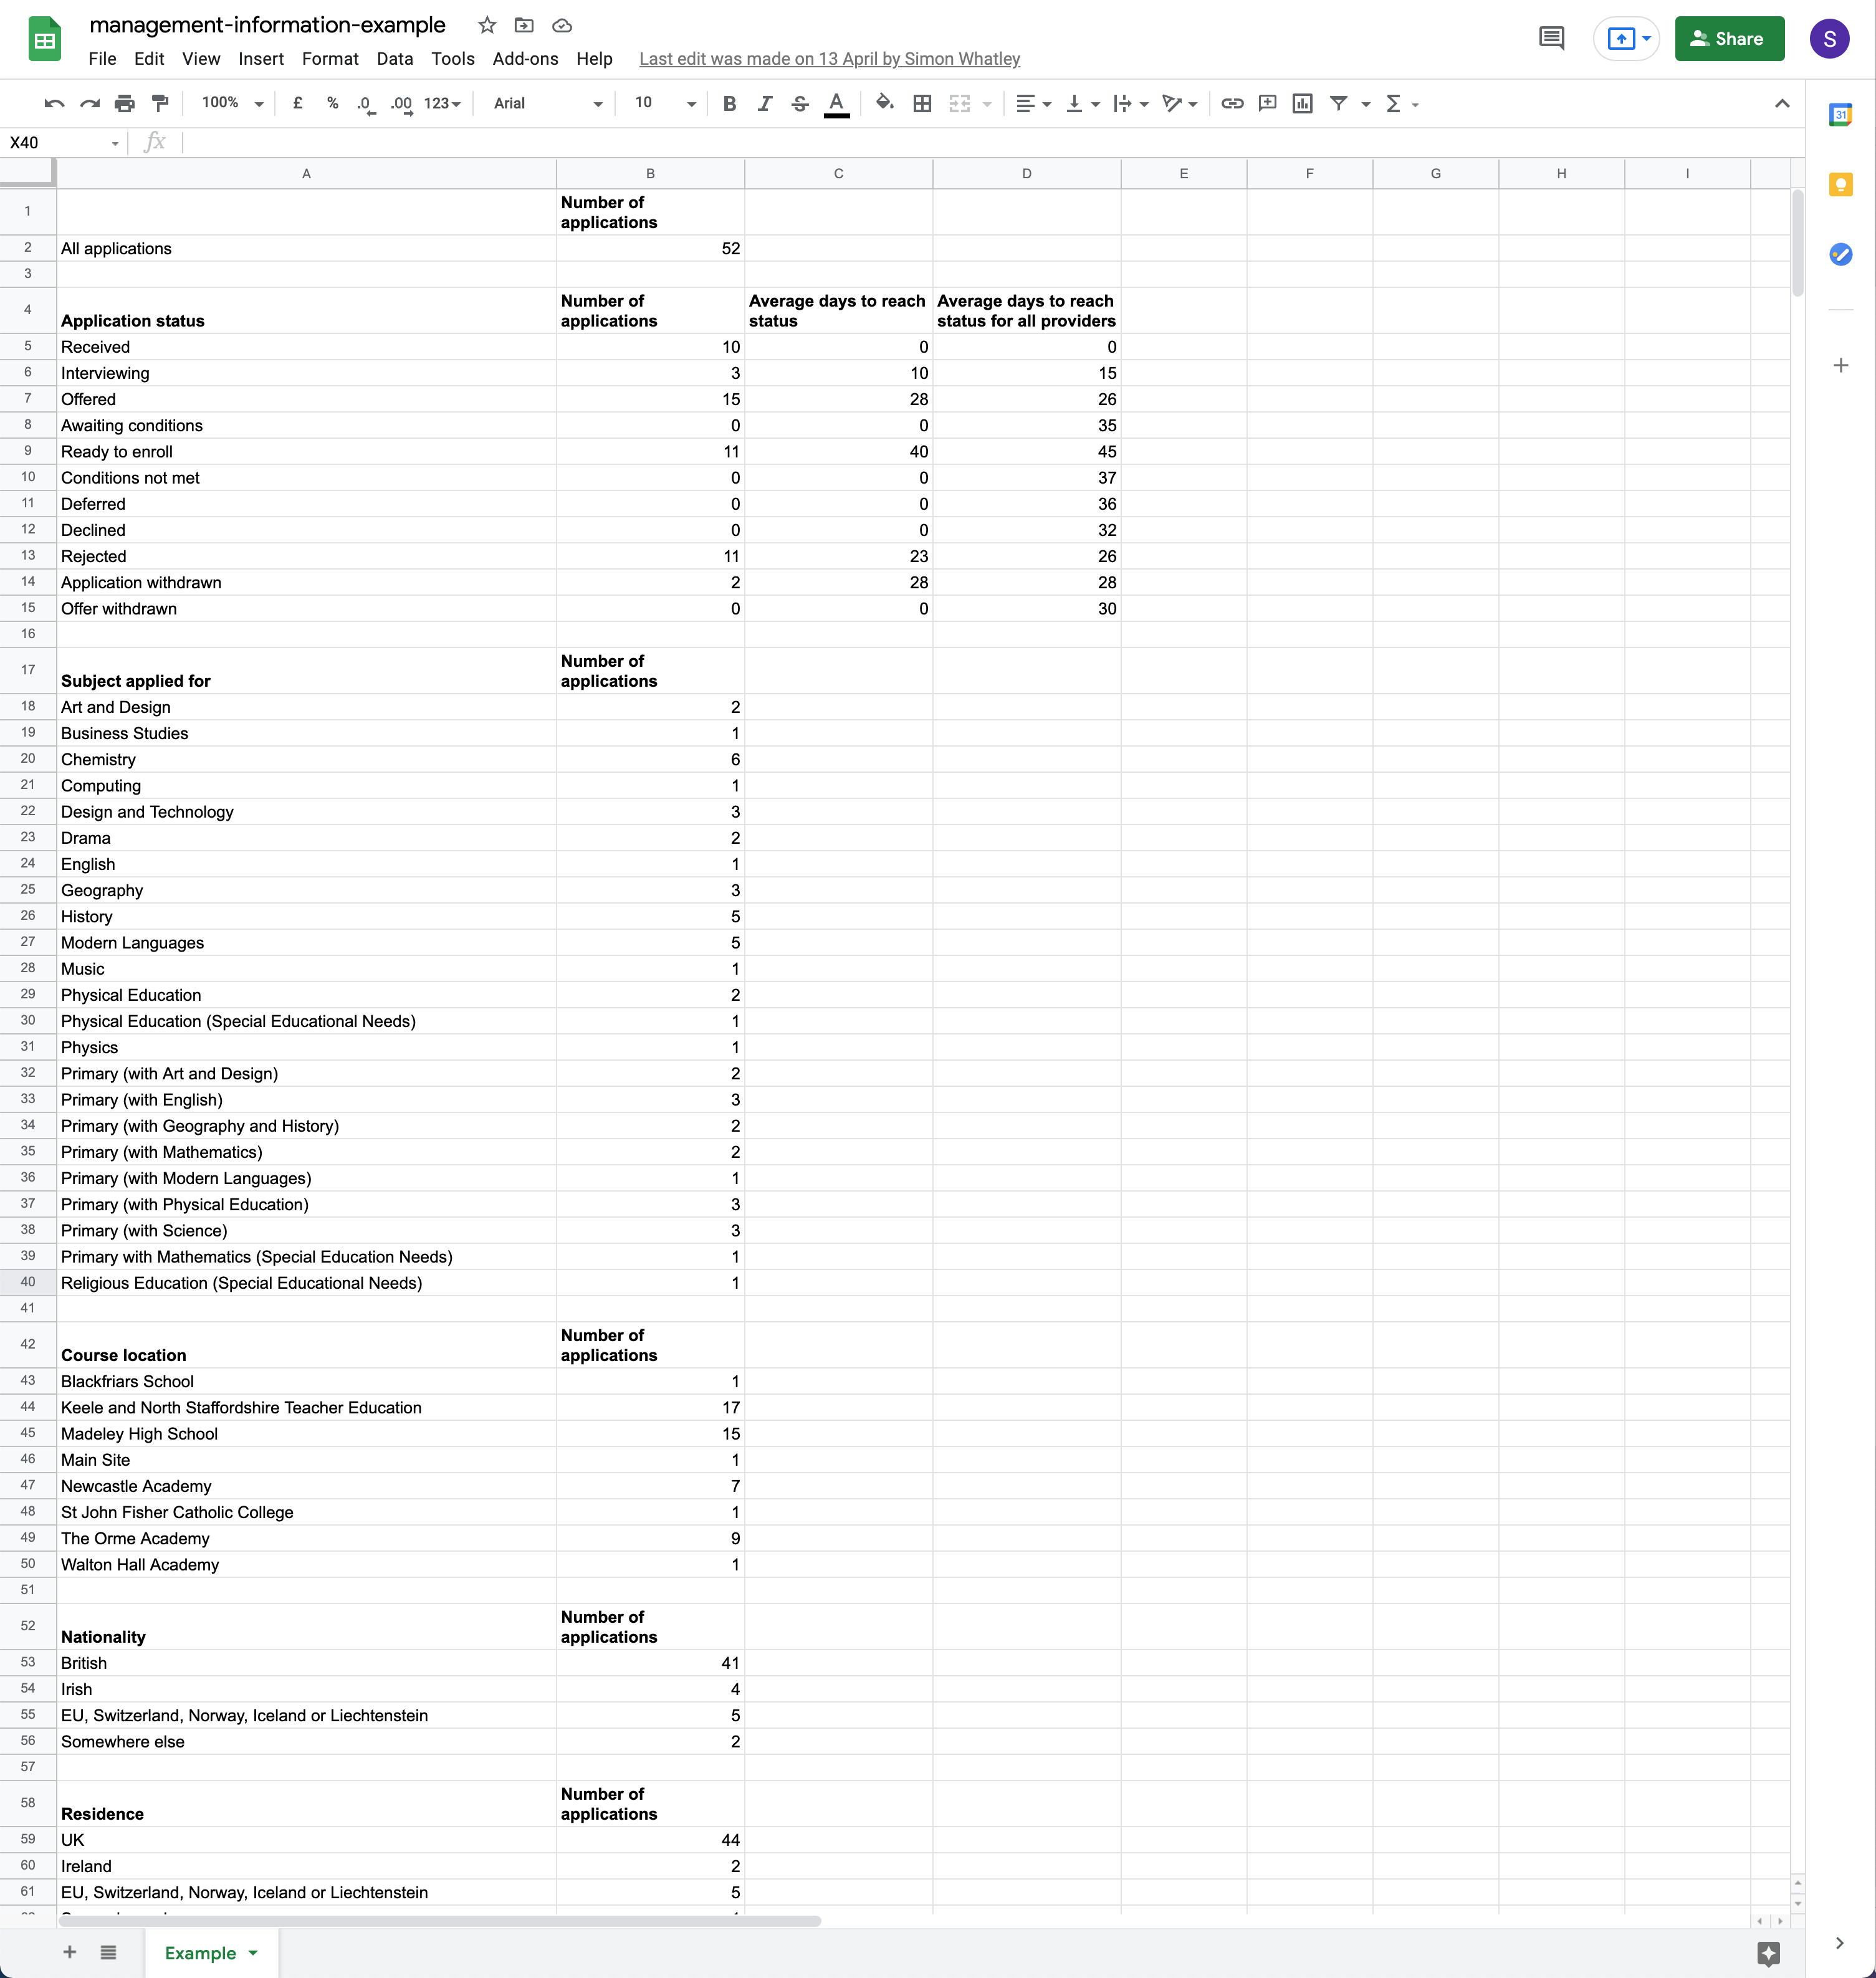
We created a spreadsheet containing data that we thought may be useful to providers.
This included the average number of days to reach each status, as well as the number of applications by:
- status
- course
- training location
- candidate’s nationality
- candidate’s country of residence
We showed this spreadsheet to research participants rather than incorporating it into the service prototype. This allowed us to focus the conversation on the data needs rather than possible designs.
What we found
We divided the needs we discovered into five categories:
- total numbers of applications
- application processing, for example the proportion of candidates who are rejected after an interview
- capacity management, for example how long it takes to process an application
- diversity, for example the ethnicity of successful and unsuccessful candidates
- marketing, for example knowing where candidates go after turning down an offer
The participants wanted to further cut the data in various ways, for example by:
- course
- partner organisation
- stage within the application process
They also wanted to compare the data to other periods, particularly the same time in the previous year.
Participants described how they used data, including:
- helping them plan staff availability
- improving and speeding up processes
- recognising and avoiding bias in recruitment
- understanding recruitment trends
- deciding whether marketing initiatives have worked
They also talked about accessing and sharing this data in various ways, including:
- looking at it on their screen
- emailing it to a colleague
- printing it, for example to take to a meeting
- downloading it as a spreadsheet to do further analysis
We found that it would be hard to meet users’ needs with only a downloadable spreadsheet.
The next round of research
We decided to focus on providing data within a new section of the service.
We used the needs we’d identified to create a series of reports. Our findings also helped us decide:
- which reports to create
- what configuration options we should offer
Screenshots#
Data shown to research participants#