When a provider rejects an application, they must select at least one category of reason for rejection. They are also asked to do this for applications which are automatically rejected.
Some categories contain a list of sub-categories. If so, the provider must select at least one sub-category.
Categories that do not contain sub-categories reveal a ‘give details’ field. Most sub-categories also reveal a ‘give details’ field. The user must complete this field.
If the user says no to all the categories then on the next page they’re given a field asking them why they’re rejecting the application. The category is considered to be ‘other reasons’.
There is a report in the support service which shows how frequently each category and sub-category is used. It includes links to pages showing the details given by provider users.
The user need we meet with this report is:
We wanted to improve the report to make it easier for users to get the information they need.
What we changed
We changed the report to:
- allow users to see data for the current or previous recruitment cycle
- list categories and sub-categories in the order in which providers see them
- add the ‘other reasons’ category which was missing from the report
- make the ‘glance metrics’ (prominent pieces of data) more useful by showing numbers and percentages for overall and recent use
- make the columns in the tables of sub-categories more useful by showing numbers and percentages for overall and recent use
We also improved the headings of the pages which give details of the reasons for rejection.
Current and previous recruitment cycles
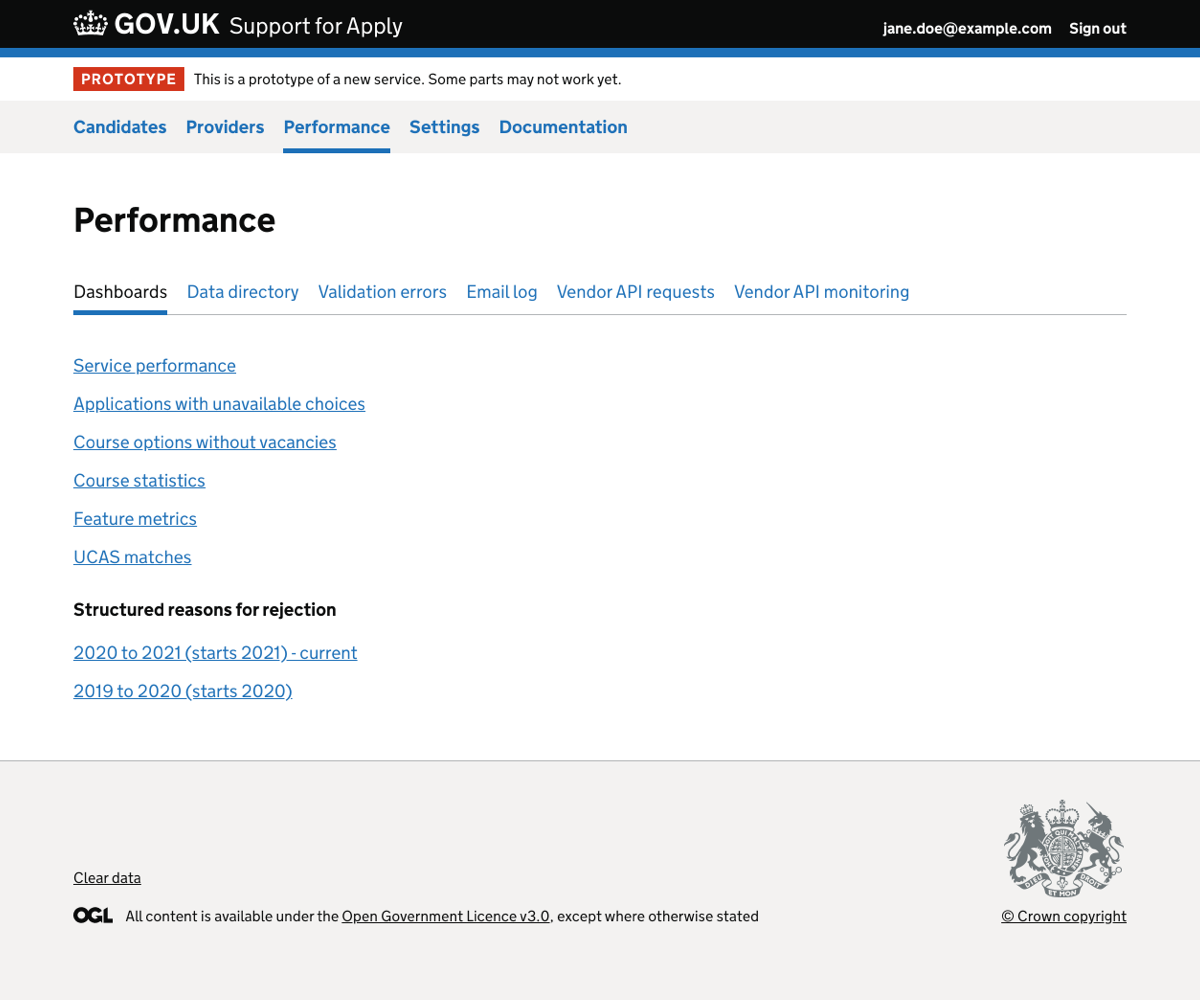
We added a section to the performance landing page called ‘Structured reasons for rejection’.
This section lists available reports by recruitment cycle, with the current cycle indicated. Initially the section will include:
- 2021 to 2022 (starts 2022) - current
- 2020 to 2021 (starts 2021)
We added the same text as a caption for the page headings on the report and details pages, so that the user can see which cycle the information is for.
Categories and sub-categories
The categories were not previously displayed in any logical order. We changed the report to show the categories in the same order as they are shown to providers.
We also added the missing ‘other reasons’ category, which providers use if the reason for rejection does not fit into any other category.
Previously support users could not see how much this category was used, or click through to the details added by providers.
The order in which we display the categories is:
- candidate behaviour
- quality of application
- qualifications
- performance at interview
- honesty and professionalism
- safeguarding
- offered a place on another course
- cannot sponsor applicant’s visa
- course full
- other reasons
- additional advice or feedback
‘Additional advice or feedback’ is not a reason for rejection. It is included in the report because providers can give it when they reject the application.
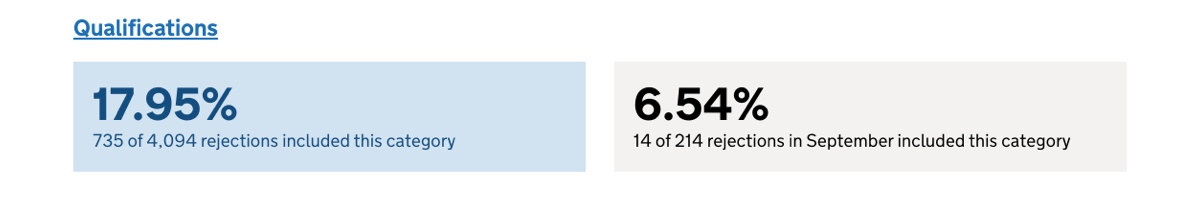
Glance metrics
The report includes ‘glance metrics’, which are important pieces of data displayed prominently. In this report they are in blue or grey shaded boxes.
Previously, each category had 3 boxes. These showed:
- total number and percentage of application choices which included the category, and the total number of application choices made by candidates
- total number of application choices which included the category
- total number of application choices which included the category in the current month
There was overlap between the contents of the first and second boxes. In addition, we did not give percentages for some numbers.
In the new design we have 2 boxes showing:
- total number and percentage of application choices which included the category, and the total number of application choices made by candidates
- number and percentage of application choices which included the category in the current month, and the number of application choices made by candidates in the current month
Instead of saying ‘this month’, we now give the name of the current month. This makes it clearer what time period the glance metrics relate to.
If the report is not for the current recruitment cycle, we remove the current month glance metric as it is not relevant. The current month of the current cycle contains only partial data, so it cannot be compared to the whole of the same month in the previous cycle.
We considered including partial data for the same month in the previous cycle, taken up to the same day of the month as in the current cycle. We decided that this is unnecessarily complicated since there we do not know of a clear need for it.
These changes make it easier for a user to understand:
- how commonly used each category is
- how the use of each category in the current month compares to the recruitment cycle so far
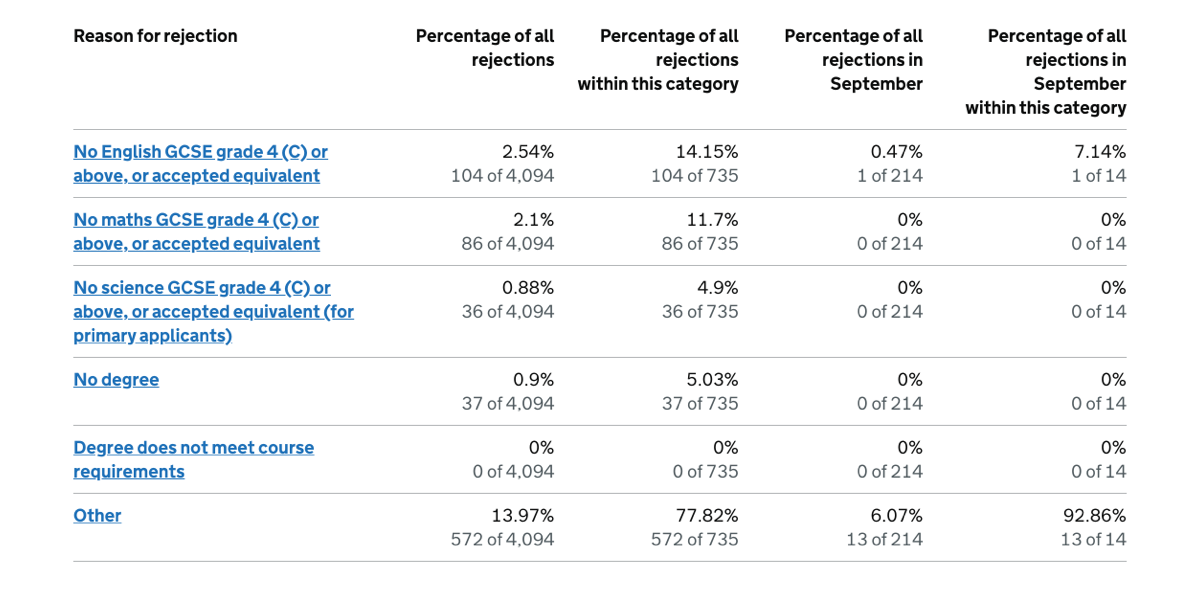
Table data
Some categories of rejection include more detailed sub-categories. In the report we display these sub-categories in a table under the category’s glance metric boxes.
Categories of rejection with sub-categories are:
- candidate behaviour
- honesty and professionalism
- qualifications
- quality of application
- safeguarding
We updated the tables to show the sub-categories in the same order as providers see them.
We removed the ‘total’ and ‘this month’ columns as the numbers alone do not indicate how common the sub-categories are.
In their place the new design has columns showing each sub-category as a percentage of:
- all rejections
- all rejections within the category
- all rejections in the current month
- all rejections in the current month within the category
We also show how each of these percentages was calculated.
If the report is not for the current recruitment cycle, we remove the current month columns as they are not relevant. The current month of the current cycle contains only partial data, so it cannot be compared to the whole of the same month in the previous cycle.
Other changes
We added a section called ‘understanding this report’ to explain that:
- the report does not include rejections made through the API - this is because they’re free text rather than structured
- the percentages for all the categories will not add up to 100%, since users can choose more than one reason for rejection
We added a caption to the page headings to show which cycle the data in the report is for.
We formatted all numbers and percentages consistently, using:
- up to 2 decimal places for each percentage, removing any trailing zeroes
- a comma to indicate thousands
Details page
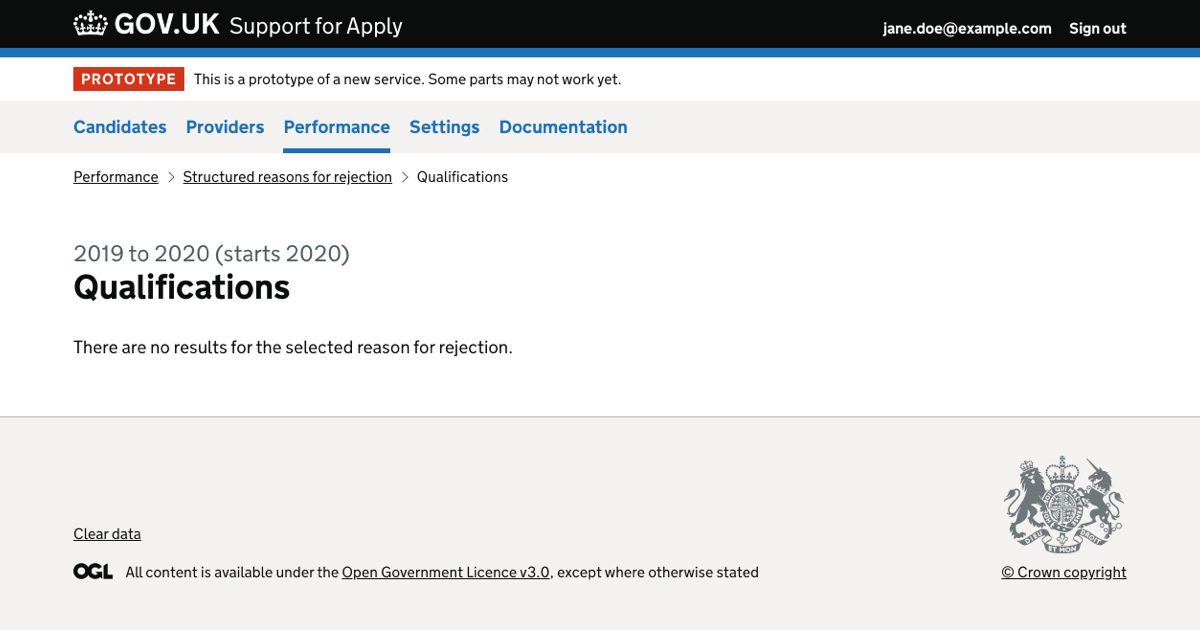
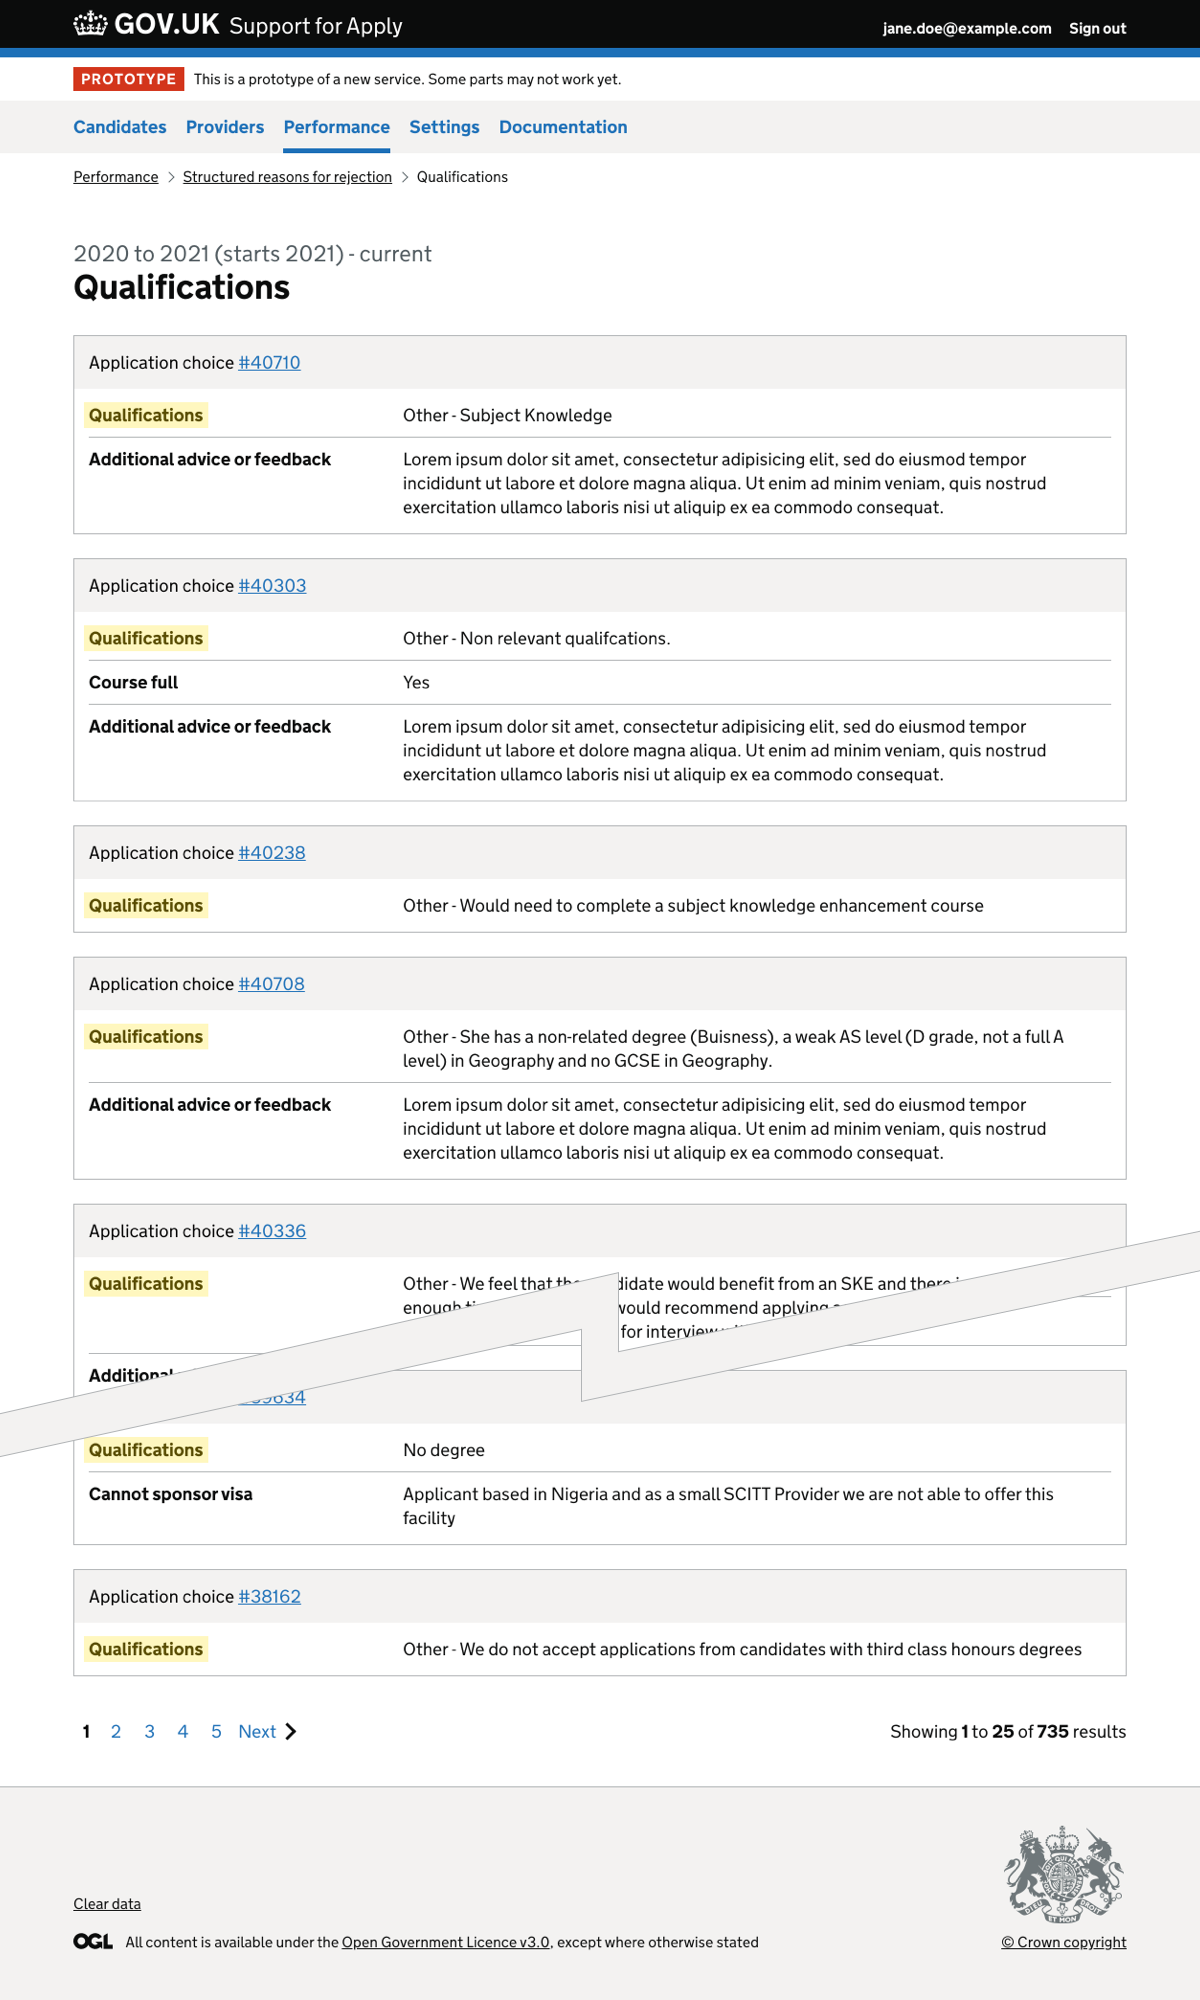
If the user clicks a category on the landing page, for example ‘qualifications’, the category will be displayed in the heading and title of the details page.
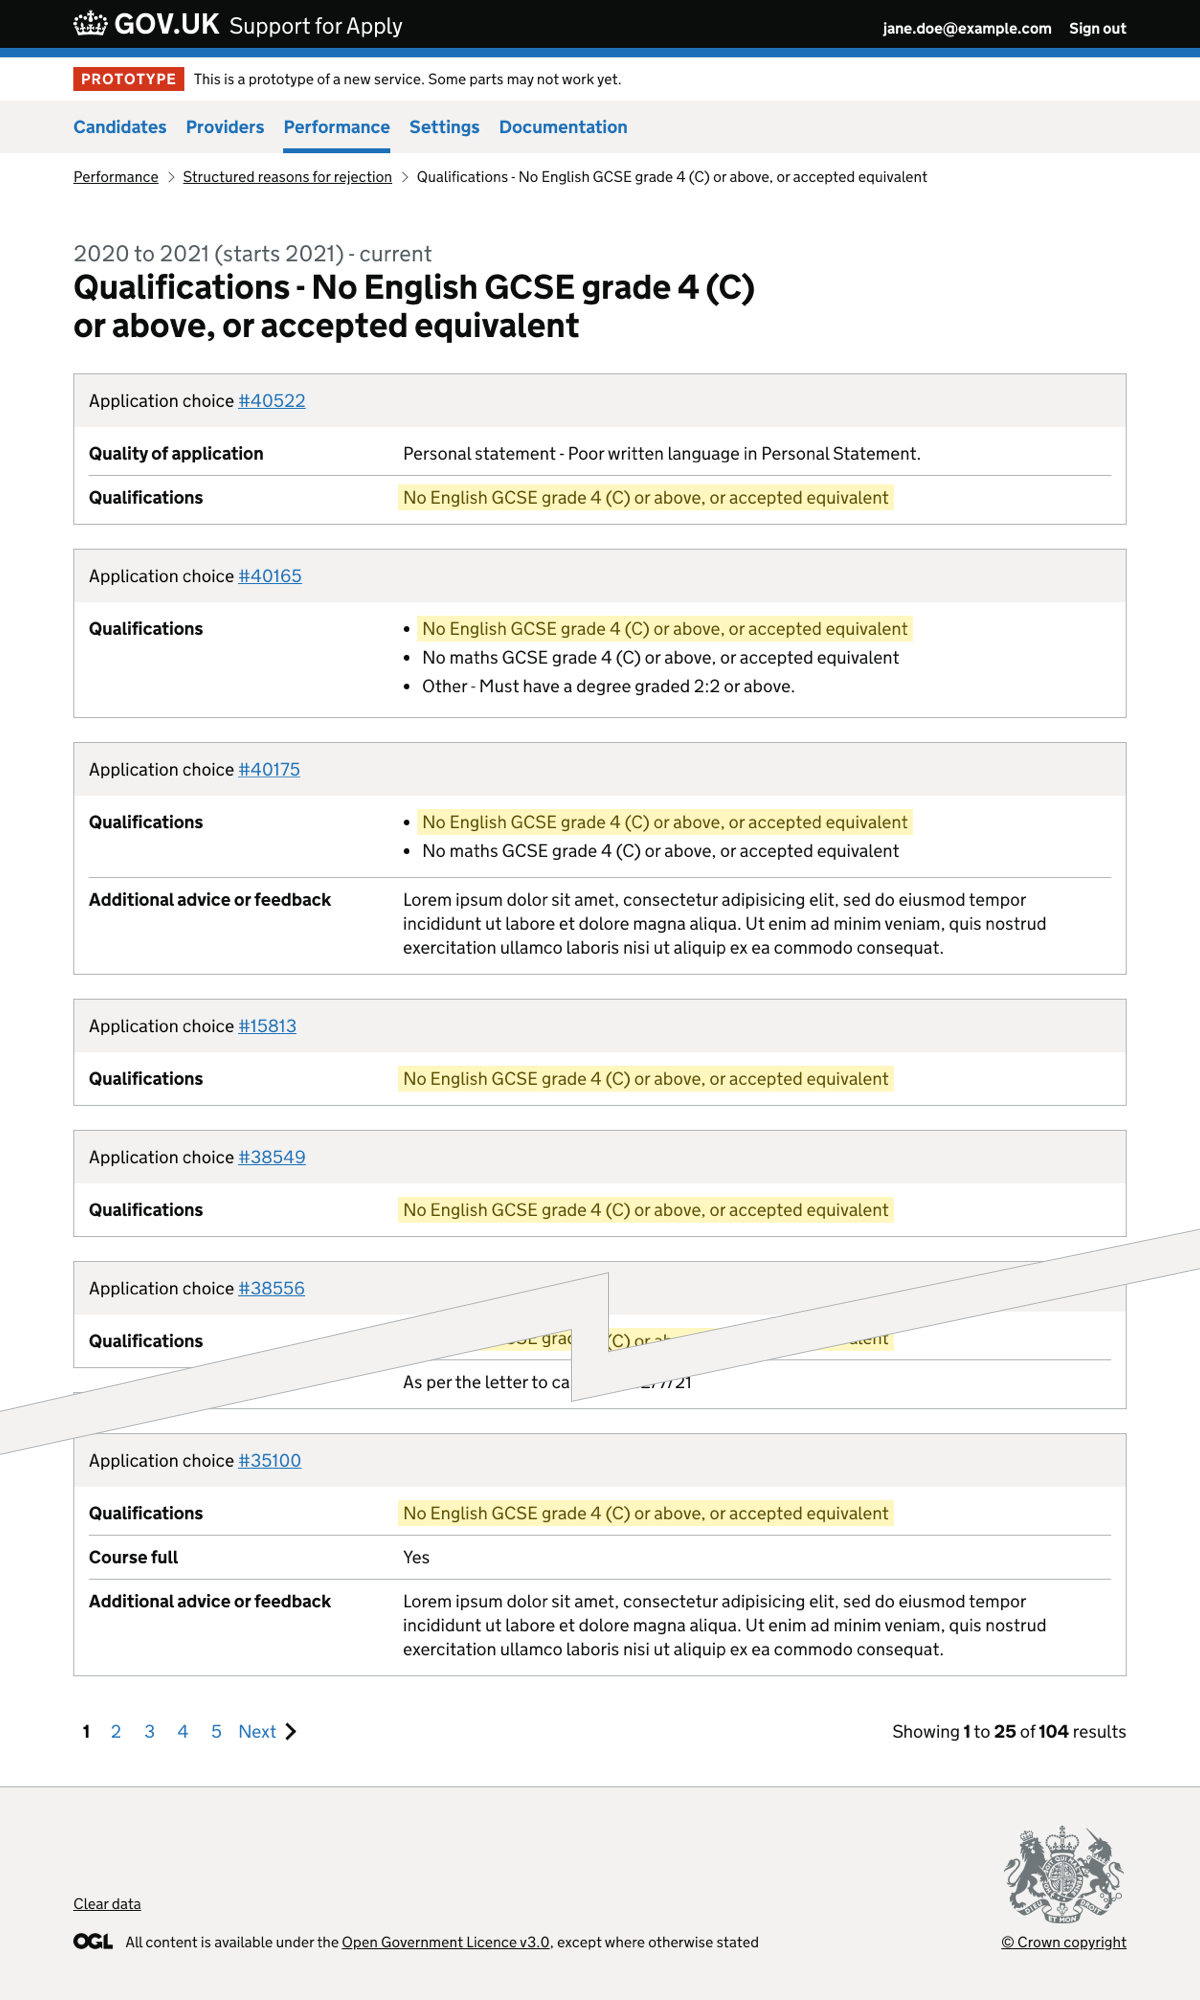
If the user clicks a sub-category, for example ‘no english GCSE grade 4 (C) or above, or accepted equivalent’, the category and sub-category will be displayed in the heading and title.
If a details page has no content, it will say “There are no results for the selected reason for rejection.”
Other considerations
We considered splitting reasons for rejection data into different parts, such as:
- separating the data for manual and automatic rejections
- showing number and percentage of rejections by month
We decided that we will only do this extra work if we find that users need it.
Screenshots#
- Performance section landing page
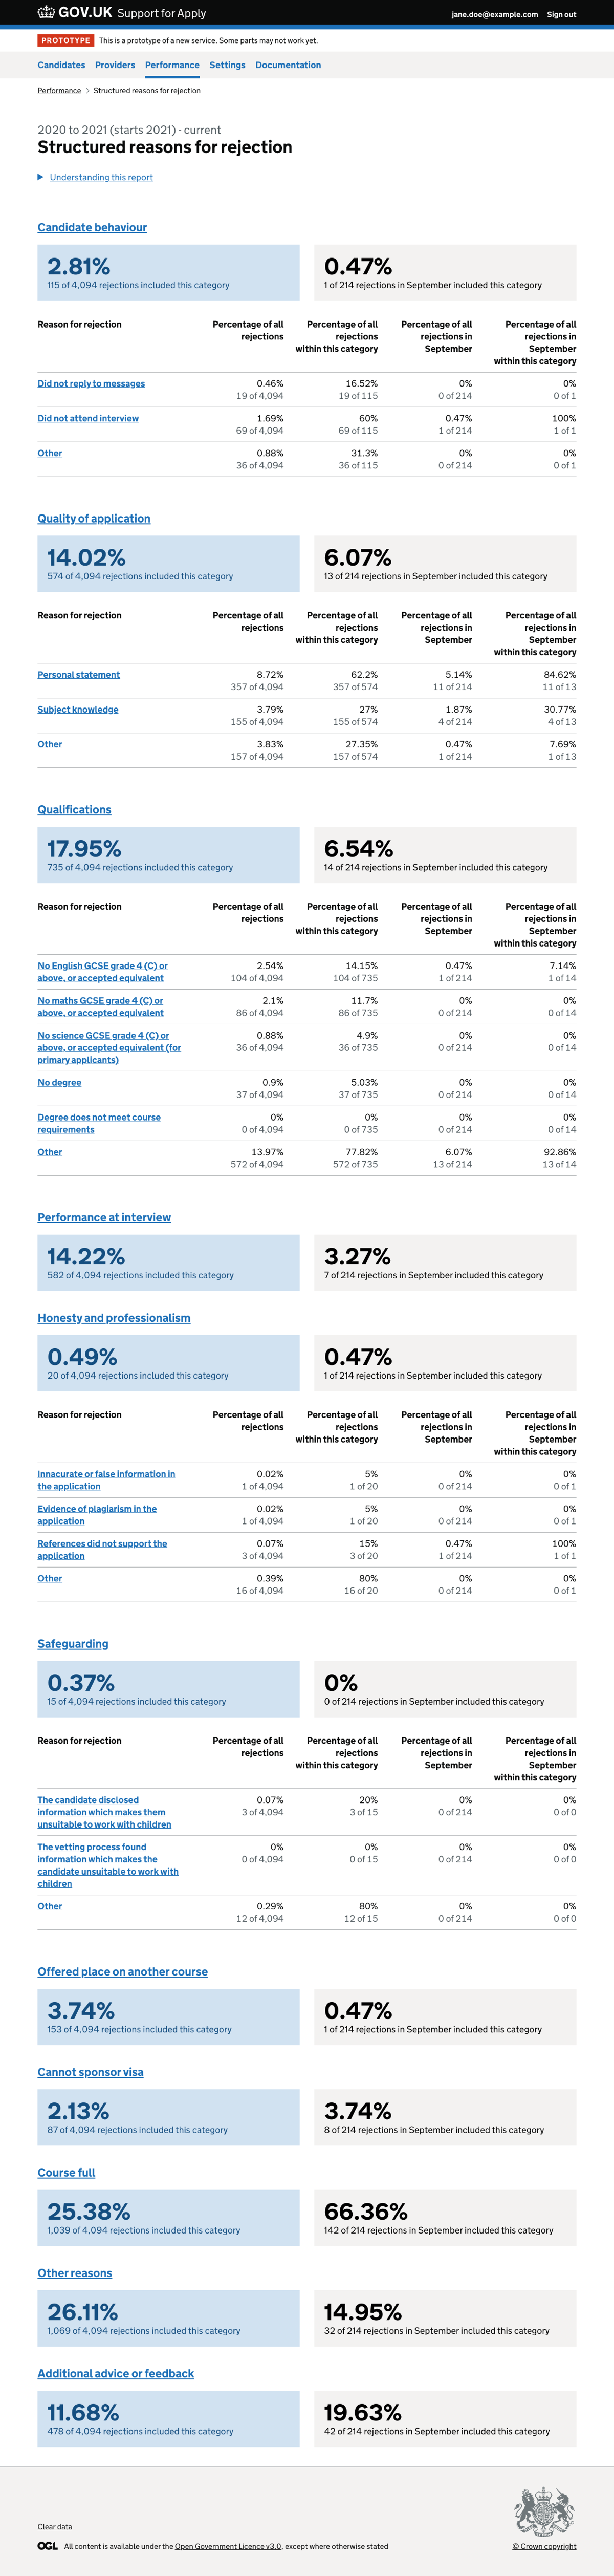
- Structured reasons for rejection report showing data for the current cycle
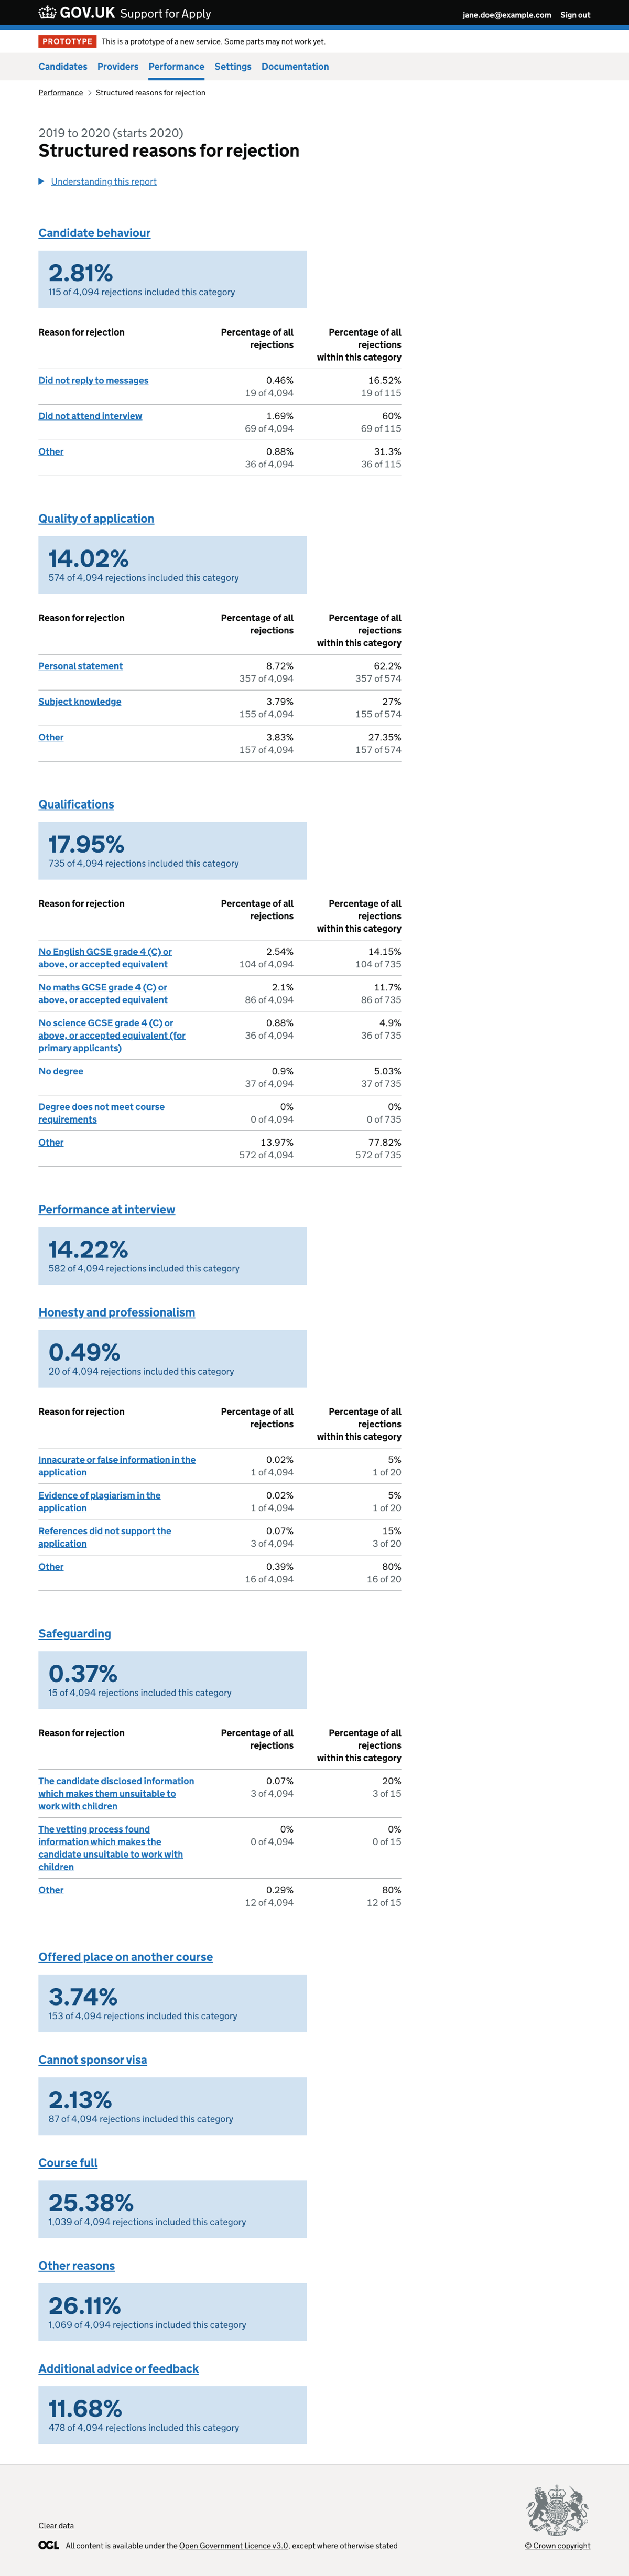
- Structured reasons for rejection report showing data for the previous cycle
- Structured reasons for rejection details showing the category
- Structured reasons for rejection details showing the category and sub-category
- Structured reasons for rejection details showing the category has no results
Performance section landing page#
Structured reasons for rejection report showing data for the current cycle#
Structured reasons for rejection report showing data for the previous cycle#
Structured reasons for rejection details showing the category#
Structured reasons for rejection details showing the category and sub-category#
Structured reasons for rejection details showing the category has no results#