This work follows on from our design to help users check how diverse their candidates are.
The user need this work aims to address is:
The aim of this iteration was to make it easier for providers to understand equality and diversity information. This will help them to spot any bias in their processes.
What we changed
We made changes to the:
- column headings and data in each table
- age groups in the age table
- section about how to understand the report
- data export for the report
Column headings and data
Previously the tables showed data for the number of:
- candidates who had applied for the provider’s courses
- candidates recruited by the provider
In research we found that participants found it hard to compare the success of different groups of candidates.
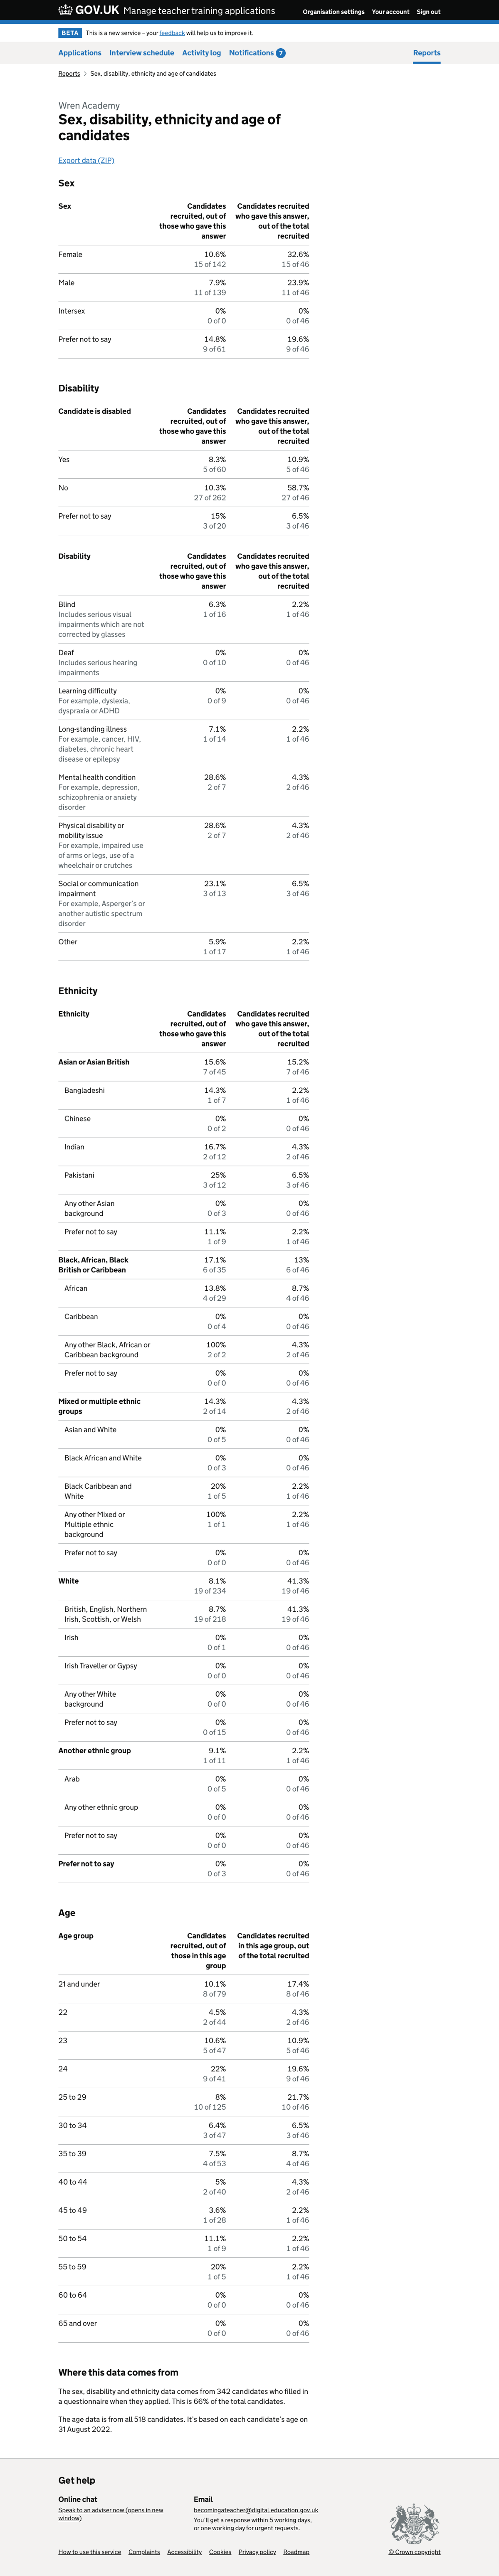
Since it’s easier to compare percentages, we decided to show both numbers and percentages. We also changed the columns to show:
- candidates recruited, out of those who gave the answer - for example, out of those who answered ‘male‘ when asked their sex
- candidates recruited who gave the answer, out of the total recruited
The first of these columns will help users spot bias in their application process. For example if a higher proportion of candidates giving the answer ‘male’ are recruited than those giving the answer ‘female’, then there may be bias.
The second column will help users understand the composition of the group of candidates they’ve recruited. It will not directly indicate bias in the provider’s processes, since it will be influenced by the number of candidates who apply in each group.
Age data
We updated the age groups in the table to match the groups used in data published by the DfE. This will make it easier for users to compare their data with national averages.
We included a sentence in the ‘understanding this report’ section to explain that ages are calculated from 31 August of the recruitment cycle.
For example, the current cycle runs from October 2021 to September 2022. We use the age of candidates on 31 August 2022.
Understanding this report
Previously candidates could choose not to answer the equality and diversity questionnaire. They are now required to answer it, but they can choose ‘prefer not to say’ for each question.
Since this change happened after the start of the recruitment cycle, there will still be some candidates who did not answer the questionnaire. We decided to keep the content saying what proportion of candidates answered it. We can remove this in the next cycle.
We decided to remove the table showing the number of candidates who applied and were recruited, split by whether or not they completed the questionnaire. Although it might help show bias, it was hard to understand and will be less useful now that all candidates answer the questionnaire.
Data export
The disability part of the report includes two tables. One shows how many candidates say they’re disabled, the other shows what type of disability candidates say they have.
The first table was missing from the export, so we added it.
Further considerations
We tell candidates that their responses to the questionnaire are anonymous until they accept an offer from a provider.
It is possible that the data in this report could be used to link a candidate’s responses to them when only a small number of applications have been received.
We considered hiding data until the provider has received a certain number of applications. We haven’t done this because:
- choosing one threshold for all providers would mean that smaller providers might only see data after several weeks or months
- the data in the report is anonymous and users would need to infer a connection - we think it’s unlikely that users would make this effort and then use the information to make an unfair decision
- other work is planned which may make diversity information available to providers before candidates make an offer
Sex, disability, ethnicity and age of candidates report#